

Cluster Market Project Report
Introduction
This project, Cluster Market, is designed to segment customers based on their purchasing behavior and characteristics using k-means clustering. The goal is to enable businesses and retailers to group customers with similar behaviors and provide more targeted and effective marketing strategies.
Data Collection and Description
The dataset was sourced from the UCI Machine Learning Repository and contains transactional data of a UK-based online retailer, spanning from December 2010 to December 2011. Due to the dataset’s size, a subset was analyzed, focusing on two key numerical attributes:
- Quantity: Number of items purchased.
- Unit Price: Price per item.
Preprocessing Steps:
- Cleaning the dataset by removing missing or erroneous entries.
- Normalizing the selected features to ensure equal contribution during clustering.
- Handling outliers to prevent distortion in clustering results.
Methodology
Algorithm: K-Means Clustering
K-means is a centroid-based, iterative clustering algorithm that partitions the dataset into distinct groups based on similarity. Each cluster is defined by its centroid, which represents the mean position of all points within the cluster.
Key Steps:
- Selecting the optimal number of clusters (k) using the Elbow Method.
- Initializing centroids and iteratively updating them to minimize the within-cluster sum of squares (WCSS).
- Assigning each data point to the nearest centroid to form clusters.
Tools and Libraries:
- Pandas: For data processing.
- Scikit-learn: For implementing k-means.
- Seaborn and Matplotlib: For visualizing clusters and patterns.
Results
The k-means algorithm grouped the data into four clusters, each representing distinct customer behaviors:
Cluster Descriptions:
- Group 0 (Purple): Customers who purchase inexpensive products in small quantities.
- Group 1 (Blue): The largest group, representing customers with moderate purchasing behavior, focusing on lower-priced items.
- Group 2 (Yellow): Customers who purchase high-priced products in small quantities, suggesting a preference for quality over quantity.
- Group 3 (Green): Customers who buy inexpensive products in bulk, possibly resellers or bulk buyers.
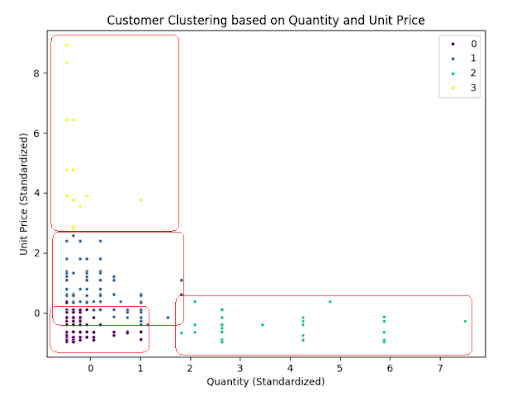
Visual Representation:
Clusters were visualized using scatter plots, showcasing the distinct segmentation of customer behaviors based on Quantity and Unit Price.
Key Insights
- Dominant Behavior: Most customers prefer inexpensive products in small quantities (Group 0).
- Bulk Buying: When purchasing in bulk, customers opt for cheaper items (Group 3).
- Premium Purchases: Expensive products are generally purchased in smaller quantities (Group 2).
These insights can guide businesses in creating tailored promotional strategies, such as:
- Offering bulk discounts for Group 3 customers.
- Highlighting premium product quality to Group 2 customers.
- Promoting affordable bundles to Group 0 customers.
Future Considerations
- Incorporating Customer Nationality:
- Analyzing purchasing behaviors by nationality to uncover regional patterns.
- Customer-Level Analysis:
- Delving into individual customer habits to identify repeat behaviors, loyalty trends, and shifts in purchasing patterns.
Conclusion
This project demonstrates the power of clustering to segment customers based on behavioral data. By categorizing customers into actionable groups, businesses can better understand their audience and implement effective, data-driven strategies. With further analysis and additional data dimensions, this segmentation can provide even deeper insights and more precise targeting.
GitHub Repository: Cluster Market Project